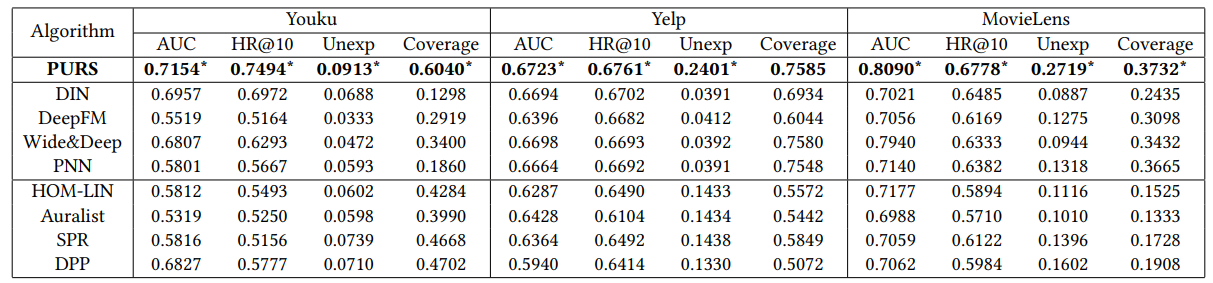
· 2 min read
Sparsh Agarwal

Live app

This app can detect COCO 80-classes using three different models - Caffe MobileNet SSD, Yolo3-tiny, and Yolo3. It can also detect faces using two different models - SSD Res10 and OpenCV face detector. Yolo3-tiny can also detect fires.

/img/content-blog-raw-blog-object-detection-with-yolo3-untitled.png

/img/content-blog-raw-blog-object-detection-with-yolo3-untitled-1.png

Code

import streamlit as st
import cv2
from PIL import Image
import numpy as np
import os

from tempfile import NamedTemporaryFile
from tensorflow.keras.preprocessing.image import img_to_array, load_img

temp_file = NamedTemporaryFile(delete=False)

DEFAULT_CONFIDENCE_THRESHOLD = 0.5
DEMO_IMAGE = "test_images/demo.jpg"
MODEL = "model/MobileNetSSD_deploy.caffemodel"
PROTOTXT = "model/MobileNetSSD_deploy.prototxt.txt"

CLASSES = [
"background",
"aeroplane",
"bicycle",
"bird",
"boat",
"bottle",
"bus",
"car",
"cat",
"chair",
"cow",
"diningtable",
"dog",
"horse",
"motorbike",
"person",
"pottedplant",
"sheep",
"sofa",
"train",
"tvmonitor",
]
COLORS = np.random.uniform(0, 255, size=(len(CLASSES), 3))

@st.cache
def process_image(image):
blob = cv2.dnn.blobFromImage(
cv2.resize(image, (300, 300)), 0.007843, (300, 300), 127.5
)
net = cv2.dnn.readNetFromCaffe(PROTOTXT, MODEL)
net.setInput(blob)
detections = net.forward()
return detections

@st.cache
def annotate_image(
image, detections, confidence_threshold=DEFAULT_CONFIDENCE_THRESHOLD
):
# loop over the detections
(h, w) = image.shape[:2]
labels = []
for i in np.arange(0, detections.shape[2]):
confidence = detections[0, 0, i, 2]

if confidence > confidence_threshold:
# extract the index of the class label from the `detections`,
# then compute the (x, y)-coordinates of the bounding box for
# the object
idx = int(detections[0, 0, i, 1])
box = detections[0, 0, i, 3:7] * np.array([w, h, w, h])
(startX, startY, endX, endY) = box.astype("int")

# display the prediction
label = f"{CLASSES[idx]}: {round(confidence * 100, 2)}%"
labels.append(label)
cv2.rectangle(image, (startX, startY), (endX, endY), COLORS[idx], 2)
y = startY - 15 if startY - 15 > 15 else startY + 15
cv2.putText(
image, label, (startX, y), cv2.FONT_HERSHEY_SIMPLEX, 0.5, COLORS[idx], 2
)
return image, labels

def main():
selected_box = st.sidebar.selectbox(
'Choose one of the following',
('Welcome', 'Object Detection')
)

if selected_box == 'Welcome':
welcome()
if selected_box == 'Object Detection':
object_detection()

def welcome():
st.title('Object Detection using Streamlit')
st.subheader('A simple app for object detection')
st.image('test_images/demo.jpg',use_column_width=True)

def object_detection():

st.title("Object detection with MobileNet SSD")

confidence_threshold = st.sidebar.slider(
"Confidence threshold", 0.0, 1.0, DEFAULT_CONFIDENCE_THRESHOLD, 0.05)

st.sidebar.multiselect("Select object classes to include",
options=CLASSES,
default=CLASSES
)

img_file_buffer = st.file_uploader("Upload an image", type=["png", "jpg", "jpeg"])

if img_file_buffer is not None:
temp_file.write(img_file_buffer.getvalue())
image = load_img(temp_file.name)
image = img_to_array(image)
image = image/255.0

else:
demo_image = DEMO_IMAGE
image = np.array(Image.open(demo_image))

detections = process_image(image)
image, labels = annotate_image(image, detections, confidence_threshold)

st.image(
image, caption=f"Processed image", use_column_width=True,
)

st.write(labels)

main()

You can play with the live app *here. Source code is available here on Github.*

· 2 min read
Sparsh Agarwal

/img/content-blog-raw-blog-ocr-experiments-untitled.png

1. Tesseract

Tesseract is an open-source text recognition engine that is available under the Apache 2.0 license and its development has been sponsored by Google since 2006.

Notebook on nbviewer

2. EasyOCR

Ready-to-use OCR with 70+ languages supported including Chinese, Japanese, Korean and Thai. EasyOCR is built with Python and Pytorch deep learning library, having a GPU could speed up the whole process of detection. The detection part is using the CRAFT algorithm and the Recognition model is CRNN. It is composed of 3 main components, feature extraction (we are currently using Resnet), sequence labelling (LSTM) and decoding (CTC). EasyOCR doesn’t have much software dependencies, it can directly be used with its API.

Notebook on nbviewer

3. KerasOCR

This is a slightly polished and packaged version of the Keras CRNN implementation and the published CRAFT text detection model. It provides a high-level API for training a text detection and OCR pipeline and out-of-the-box OCR models, and an end-to-end training pipeline to build new OCR models.

Notebook on nbviewer

4. ArabicOCR

It is an OCR system for the Arabic language that converts images of typed text to machine-encoded text. It currently supports only letters (29 letters). ArabicOCR aims to solve a simpler problem of OCR with images that contain only Arabic characters (check the dataset link below to see a sample of the images).

Notebook on nbviewer

· 2 min read
Sparsh Agarwal

/img/content-blog-raw-blog-pdf-to-wordcloud-via-mail-untitled.png

Objective

Integrating PDF, Text, Wordcloud and Email functionalities in Python

Process Flow

  • Step 1 - I use PyPDF2 library to read PDF text in Python
  • Step 2 - Import the supporting libraries
  • Step 3 - Count No. of Pages for this pdf and extract text for each page using loop
  • Step 4 - Build Text corpus by simply attaching text of next page to all the previous ones
  • Step 5 - Creating word frequency dataframe by first splitting text into words and counting the frequency of each word
  • Step 6.1 - Pre-process text i.e. removing stopwords (using nltk library), grouping common words.
  • Step 6.2 - used regex to extract alphabets only, lower all chracters, and sorting as per decreasing order of frequency.
  • Step 7 - Creating Wordcloud using matplotlib and wordcloud libraries
  • Step 8 - Importing required libraries like smtplib, MIME, win32 for sending the mail
  • Step 9 - Create outlook mail object with supporting data like filepath attachment, recepient address, mail body etc.
  • Step 10 - Sending the mail with required wordcloud image file attached and checking if mail is received or not!

Code

Notebook on nbviewer

· 3 min read
Sparsh Agarwal

Classical recommender systems typically provides familier items, which not only bores customer after some time, but create a critical bias problem also, generally known as filter bubble or echo chamber problem.

To address this issue, instead of recommending best matching product all the time, we intentionally recommend a random product. For example, if a user subscribed to Netflix one month ago and watching action movies all the time. If we recommend another action movie, there is a high probability that user will click but keeping in mind the long-term user satisfaction and to address the filter bubble bias, we would recommend a comedy movie. Surprisingly, this strategy works!!

The most common metric is diversity factor but diversity only measures dispersion among recommended items. The better alternative is unexpectedness factor. It measures deviations of recommended items from user expectations and thus captures the concept of user surprise and allows recommender systems to break from the filter bubble. The goal is to provide novel, surprising and satisfying recommendations.

Including session-based information into the design of an unexpected recommender system is beneficial. For example, it is more reasonable to recommend the next episode of a TV series to the user who has just finished the first episode, instead of recommending new types of videos to that person. On the other hand, if the user has been binge-watching the same TV series in one night, it is better to recommend something different to him or her.

Model

/img/content-blog-raw-blog-personalized-unexpectedness-in-recommender-systems-untitled.png

Overview of the proposed PURS model. The base model estimates the click-through rate of certain user-item pairs, while the unexpected model captures the unexpectedness of the new recommendation as well as user perception towards unexpectedness.

Offline Experiment Results

/img/content-blog-raw-blog-personalized-unexpectedness-in-recommender-systems-untitled-1.png

Online A/B Test Results

Authors conducted the online A/B test at Alibaba-Youku, a major video recommendation platform from 2019-11 to 2019-12. During the testing period, they compared the proposed PURS model with the latest production model in the company. They measured the performance using standard business metrics: VV (Video View, average video viewed by each user), TS (Time Spent, average time that each user spends on the platform), ID (Impression Depth, average impression through one session) and CTR (Click-Through-Rate, the percentage of user clicking on the recommended video). They also measure the novelty of the recommended videos using the unexpectedness and coverage measures.

Represents statistical significance at the 0.95 level.

Represents statistical significance at the 0.95 level.

Code Walkthrough

Note: PURS is implemented in Tensorflow 1.x

Unexpected attention (model.py)

def unexp_attention(self, querys, keys, keys_id):
"""
Same Attention as in the DIN model
queries: [Batchsize, 1, embedding_size]
keys: [Batchsize, max_seq_len, embedding_size] max_seq_len is the number of keys(e.g. number of clicked creativeid for each sample)
keys_id: [Batchsize, max_seq_len]
"""
querys = tf.expand_dims(querys, 1)
keys_length = tf.shape(keys)[1] # padded_dim
embedding_size = querys.get_shape().as_list()[-1]
keys = tf.reshape(keys, shape=[-1, keys_length, embedding_size])
querys = tf.reshape(tf.tile(querys, [1, keys_length, 1]), shape=[-1, keys_length, embedding_size])

net = tf.concat([keys, keys - querys, querys, keys*querys], axis=-1)
for units in [32,16]:
net = tf.layers.dense(net, units=units, activation=tf.nn.relu)
att_wgt = tf.layers.dense(net, units=1, activation=tf.sigmoid) # shape(batch_size, max_seq_len, 1)
outputs = tf.reshape(att_wgt, shape=[-1, 1, keys_length], name="weight") #shape(batch_size, 1, max_seq_len)
scores = outputs
scores = scores / (embedding_size ** 0.5) # scale
scores = tf.nn.softmax(scores)
outputs = tf.matmul(scores, keys) #(batch_size, 1, embedding_size)
outputs = tf.reduce_sum(outputs, 1, name="unexp_embedding") #(batch_size, embedding_size)
return outputs

Unexpected metric calculation (train.py)

def unexpectedness(sess, model, test_set):
unexp_list = []
for _, uij in DataInput(test_set, batch_size):
score, label, user, item, unexp = model.test(sess, uij)
for index in range(len(score)):
unexp_list.append(unexp[index])
return np.mean(unexp_list)

References

  1. https://arxiv.org/pdf/2106.02771v1.pdf
  2. https://github.com/lpworld/PURS

· 2 min read
Sparsh Agarwal

/img/content-blog-raw-blog-predicting-electronics-resale-price-untitled.png

Objective

Predict the resale price based on brand, part id and purchase quantity

Milestones

  • Data analysis and discovery - What is the acceptable variance the model needs to meet in terms of similar part number and quantity?
  • Model research and validation - Does the model meet the variance requirement? (Variance of the model should meet or be below the variance of the sales history)
  • Model deployment - Traffic will increase 10 fold. So, model needs to be containerized or dockerized
  • Training - Model needs to be trainable on new sales data. Methodology to accept or reject the variance of the newly trained model documented.

Deliverables

  1. Data Analysis and Discovery (identify target variance for pricing model in terms of similar part numbers and quantities). Analysis should be done on the 12 following quantity ranges: 1-4, 5-9, 10-24, 25-49, 50-99, 100-249, 250-499, 500-999, 1000-2499, 2500-4999, 5000-9999, 10000+.

  2. ModelA Training (Resale Value Estimation [$] (Brand+PartNo.+Quantity)

  3. ModelA Validation (variance analysis and comparison with sales history variance in terms of similar part numbers and quantities)

  4. ModelA Containerization

  5. ModelA re-training based on new sales data

  6. ScriptA to calculate variance for new sales data (feedback for training results)

  7. Documentation for re-training

  8. ModelA deployment and API

Modeling Approach

Framework

  • Fully connected regression neural network
  • NLP feature extraction from part id
  • Batch generator to feed large data in batches
  • Hyperparameter tuning to find the best model fit

List of Variables

  • 2 years of sales history
  • PRC
  • PARTNO
  • ORDER_NUMBER
  • ORIG_ORDER_QTY
  • UNIT_COST
  • UNIT_REASLE
  • UOM (UNIT OF MEASUREMENT)

Bucket of Ideas

  1. Increase n-gram range; e.g. in part_id ABC-123-23, these are 4-grams: ABC-, BC-1, C-12, -123, 123-, 23-2, 3-23; Idea is to see if increasing this range further will increase the model's performance
  2. Employ Char-level LSTM to capture sequence information; e.g. in same part_id ABC-123-23, currently we are not maintaining sequence of grams, we don't know if 3-23 is coming at first or last; here, the idea is to see if lstm model can be employed to capture this sequence information to improve model's performance
  3. New Loss function - including cost based loss

· 10 min read
Sparsh Agarwal

Overview

News recommendation system has a high degree of real-time because there will be a large number of news and hot spots at any time. Incremental updating, online learning, local updating and even reinforcement learning can make the recommender system quickly respond to the user‘s new behavior, and the premise of these updating strategies is that the sample itself has enough real-time information. In news recommendation system, the typical training sample is the user’s click behavior data.

Why is the real-time nature of the recommendation system important?

Intuitively, when users use personalized news applications, users expect to find articles that match their interests faster; when using short video services, they expect to "flash" content that they are interested in faster; when doing online shopping, I also hope to find the products that I like, faster. All recommendations highlight the word "fast", which is an intuitive manifestation of the "real-time" role of the recommendation system.

From a professional point of view, the real-time performance of the recommendation system is also crucial, which is mainly reflected in the following two aspects:

  1. The faster the update speed of the recommendation system is, the more it can reflect the user's recent user habits, and the more time-sensitive it can make recommendations to the user.
  2. The faster the recommendation system is updated, the easier it is for the model to find the latest popular data patterns, and the more it can make the model react to find the latest fashion trends.

The real-time nature of the "feature" of the recommendation system

Suppose a user has watched a 10-minute "badminton teaching" video in its entirety. Then there is no doubt that the user is interested in the subject of "badminton". The system hopes to continue to recommend "badminton" related videos when the user turns the page next time. However, due to the lack of real-time features of the system, the user’s viewing history cannot be fed back to the recommendation system in real time. As a result, the recommendation system learned that the user had watched the video "Badminton Teaching". It was already half an hour later. Has left the app. This is an example of recommendation failure caused by poor real-time performance of the recommendation system.

It is true that the next time the user opens the application, the recommendation system can use the last user behavior history to recommend "badminton" related videos, but the recommendation system undoubtedly loses what is most likely to increase user viscosity and increase user retention. opportunity.

The real-time nature of the "model" of the recommender system

No matter how strong the real-time feature is, the scope of influence is limited to the current user. Compared with the real-time nature of "features", the real-time nature of the recommendation system model is often considered from a more global perspective . The real-time nature of the feature attempts to describe a person with more accurate features, so that the recommendation system can give a recommendation result that is more in line with the person. The real-time nature of the model hopes to capture new data patterns at the global level faster and discover new trends and relevance.

Take, for example, a large number of promotional activities on Double Eleven on an e-commerce website. The real-time nature of the feature will quickly discover the products that the user may be interested in based on the user's recent behavior, but will never find the latest preferences of similar users, the latest correlation information between the products, and the trend information of new activities.

To discover such global data changes, the model needs to be updated faster. The most important factor affecting the real-time performance of the model is the training method of the model.

  1. Full update - The most common way of model training is full update. The model will use all training samples in a certain period of time for retraining, and then replace the "outdated" model with the new trained model. However, the full update requires a large amount of training samples, so the training time required is longer; and the full update is often performed on offline big data platforms, such as spark+tensorflow, so the data delay is also longer, which leads to the full update It is the worst "real-time" model update method. In fact, for a model that has been trained, it is enough to learn only the newly added incremental samples, which is called incremental update.
  2. Incremental update (Incremental Learning) - Incremental update only feeds newly added samples to the model for incremental learning . Technically, deep learning models often use stochastic gradient descent (SGD) and its variants for learning. The model's learning of incremental samples is equivalent to continuing to input incremental samples for gradient descent on the basis of the original samples. Therefore, based on the deep learning model, it is not difficult to change from full update to incremental update. But everything in engineering is a tradeoff, there is never a perfect solution, and incremental updates are no exception. Since only incremental samples are used for learning, the model also converges to the best point of the new sample after multiple epochs, and it is difficult to converge to the global best point of all the original samples + incremental samples. Therefore, in the actual recommendation system, the incremental update and the global update are often combined . After several rounds of incremental update, the global update is performed in a time window with a small business volume, and the model is corrected after the incremental update process. Accumulated errors in. Make trade-offs and trade-offs between "real-time performance" and "global optimization".
  3. Online learning - "Online learning" is a further improvement of "incremental update", "incremental update" is to perform incremental update when a batch of new samples is obtained, and online learning is to update the model in real time every time a new sample is obtained. Online learning can also be implemented technically through SGD. But if you use the general SGD method, online learning will cause a very serious problem, that is, the sparsity of the model is very poor, opening too many "fragmented" unimportant features. We pay attention to the "sparseness" of the model in a sense that is also an engineering consideration. For example, in a model with an input vector of several million dimensions, if the sparsity of the model is good, the effect of the model can be maintained without affecting the model. , Only make the corresponding weight of the input vector of a very small part of the dimension non-zero, that is to say, when the model is online, the volume of the model is very small, which is undoubtedly beneficial to the entire model serving process. Both the memory space required to store the model and the speed of online inference will benefit from the sparsity of the model. If the SGD method is used to update the model, it is easier to generate a large number of features with small weights than the batch method, which increases the difficulty of model deployment and update. So in order to take into account the training effect and model sparsity in the online learning process, there are a lot of related researches. The most famous ones include Microsoft's RDA, Google's FOBOS and the most famous FTRL, etc.
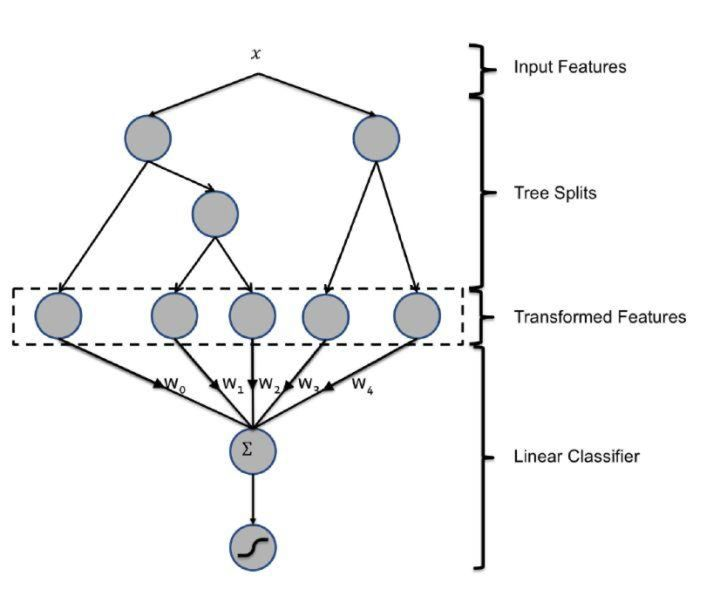
  4. Partial model update - Another improvement direction to improve the real-time performance of the model is to perform a partial update of the model. The general idea is to reduce the update frequency of the part with low training efficiency and increase the update frequency of the part with high training efficiency . This approach is representative of the GBDT+LR model of Facebook.

/img/content-blog-raw-blog-real-time-news-personalization-with-flink-untitled.png

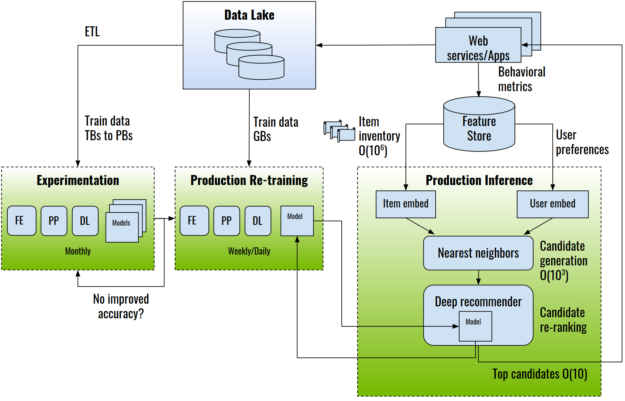
Data pipeline of a typical news recommendation system

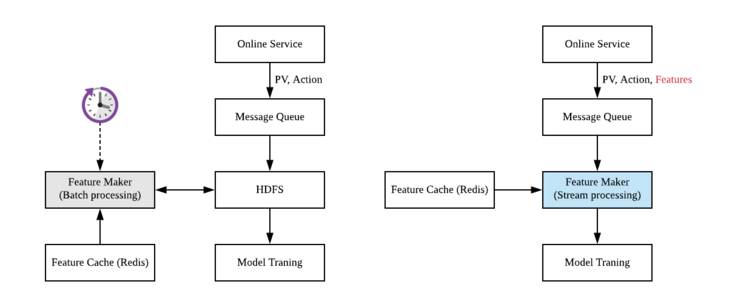
When a user is exposed with a list of news articles, a page view events are sent to the backend server and when that user clicks on the news of interest, the action events are also sent to the backend server. After receiving these 2 event streams (page view and clicks), the backend server will send these user behaviour events to the message queue. And message queue finally stores these messages into the distributed file system, such as HDFS.

For model training, we need a training sample. The most common sampling technique is negative sampling. In this, we generate 'n' negative samples for each positive event that we receive. Users will only generate behavior for some exposed news samples, which are positive samples, and the remaining exposure samples without behavior are negative samples. After generating positive and negative samples, the model can be trained.

The recommendation system with low real-time requirements can use batch processing technology (APACHE spark is a typical tool) to generate samples, as shown in the left figure. Set a timing task, and read the user behavior log and exposure log in the time window from HDFS every other period of time, such as one hour, to perform join operation, generate training samples, and then write the training samples back to HDFS, Then start the training update of the model.

/img/content-blog-raw-blog-real-time-news-personalization-with-flink-untitled-1.png

Problems

One obvious problem with batch processing is latency. The typical cycle of running batch tasks regularly is one hour, which means that there is a delay of at least one hour from sample generation to model training. Sometimes, if the batch platform is overloaded and the tasks need to be queued, the delay will be greater.

Another problem is the boundary problem. If page view (PV) data is generated at the end of the log time window selected by the batch task, the corresponding action data may fall into the next time window of the batch task, resulting in join failure and false negative samples.

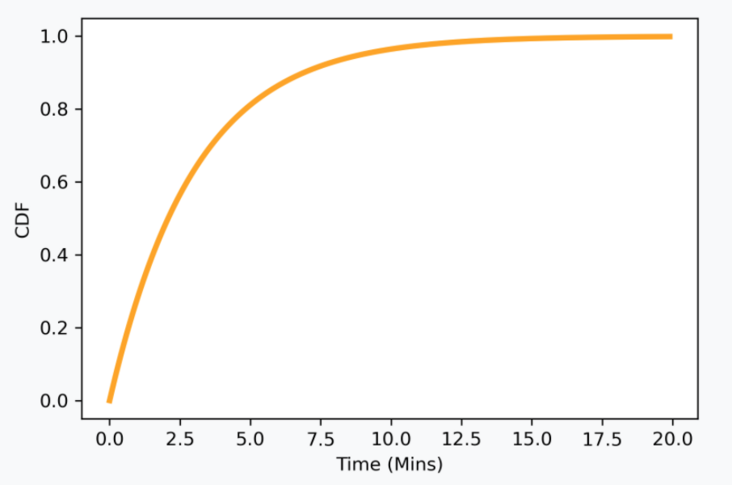
A related problem to this is the time synchronization problem. When a news item is exposed to the user, the user may click immediately after the PV data stream is generated, or the user may act after a few minutes, more than ten minutes, or even several hours. This means that after the PV data stream arrives, it needs to wait for a period of time to join with the action data stream. If the waiting time is too long, some samples (positive samples) that should have user behavior will be wrongly marked as negative samples because the user behavior has no time to return. Too long waiting time will damage and increase the system delay. Offline analysis of the delay distribution between the actual action data stream and PV data stream is a very typical exponential distribution.

/img/content-blog-raw-blog-real-time-news-personalization-with-flink-untitled-2.png

In order to enhance the real-time performance, we use Apache Flink framework to rewrite the sample generation logic with stream processing technology. As shown in the right figure above, after the user exposure and behavior logs generated by online services are written into the message queue, instead of waiting for them to drop to HDFS, we directly consume these message flows with Flink. At the same time, Flink reads the necessary feature information from the redis cache and generates the sample message stream directly. The sample message flow is written back to the Kafka queue, and downstream tensorflow can directly consume the message flow for model training.

As per the exponential distribution (analyzed on a private dataset of a news recommender app), most of the user behavior has reflow within a few minutes. And if few minutes is an acceptable delay, a simple solution is to set a time window with a compromise size. Flink provides window join to implement this logic.

References

  1. https://developpaper.com/flink-streaming-processing-and-real-time-sample-generation-in-recommender-system/
  2. https://zhuanlan.zhihu.com/p/74813776
  3. https://zhuanlan.zhihu.com/p/75597761

· 2 min read
Sparsh Agarwal

/img/content-blog-raw-blog-semantic-similarity-untitled.png

Introduction

Deliverable - Two paragraph-level distance outputs for L and Q, each has 35 columns.

For each paragraph, we need to calculate the L1 distance of consecutive sentences in this paragraph, and then generate the mean and standard deviation of all these distances for this paragraph. For example, say the paragraph 1 starts from sentence1 and ends with sentence 5. First, calculate the L1 distances for L1(1,2), L1(2,3), L1(3,4) and L1(4,5) and then calculate the mean and standard deviation of the 4 distances. In the end we got two measures for this paragraph: L1_m and L1_std. Similarly, we need to calculate the mean and standard deviation using L2 distance, plus a simple mean and deviation of the distances. We use 6 different embeddings: all dimensions of BERT embeddings, 100,200 and 300 dimensions of PCA Bert embeddings (PCA is a dimension reduction technique

In the end, we will have 35 columns for each paragraph : Paragraph ID +#sentences in the paragraph +(cosine_m, cosine_std,cossimillarity_m, cosimmilarity_std, L1_m, L1_std, L2_m, L2_std ) – by- ( all, 100, 200, 300)= 3+8*4.

Note: for paragraph that only has 1 sentence, the std measures are empty.

Modeling Approach

Process Flow for Use Case 1

  1. Splitting paragraphs into sentences using 1) NLTK Sentence Tokenizer, 2) Spacy Sentence Tokenizer and, on two additional symbols : and ...
  2. Text Preprocessing: Lowercasing, Removing Non-alphanumeric characters, Removing Null records, Removing sentence records (rows) having less than 3 words.
  3. TF-IDF vectorization
  4. LSA over document-term matrix
  5. Cosine distance calculation of adjacent sentences (rows)

Process Flow for Use Case 2

  • Split paragraphs into sentences
  • Text cleaning
  • BERT Sentence Encoding
  • BERT PCA 100
  • BERT PCA 200
  • BERT PCA 300
  • Calculate distance between consecutive sentences in the paragraph
  • Distances: L1, L2 and Cosine and Cosine similarity
  • Statistics: Mean, SD

Experimental Setup

  1. #IncrementalPCA
  2. GPU to speed up
  3. Data chunking
  4. Calculate BERT for a chunk and store in disk

· 3 min read
Sparsh Agarwal

Matching micro-videos with suitable background music can help uploaders better convey their contents and emotions, and increase the click-through rate of their uploaded videos. However, manually selecting the background music becomes a painstaking task due to the voluminous and ever-growing pool of candidate music. Therefore, automatically recommending background music to videos becomes an important task.

In this paper, Zhu et. al. shared their approach to solve this task. They first collected ~3,000 background music from popular TikTok videos and also ~150,000 video clips that used some kind of background music. They named this dataset TT-150K.

An exemplar subset of videos and their matched background music in the established TT-150k dataset

An exemplar subset of videos and their matched background music in the established TT-150k dataset

After building the dataset, they worked on modeling and proposed the following architecture:

Proposed CMVAE (Cross-modal Variational Auto-encoder) framework

Proposed CMVAE (Cross-modal Variational Auto-encoder) framework

The goal is to represent videos (users in recsys terminology) and music (items) in a shared latent space. To achieve this, CMVAE use pre-trained models to extract features from unstructured data - vggish model for audio2vec, resnet for video2vec and bert-multilingual for text2vec. Text and video vectors are then fused using product-of-expert approach.

It uses the reconstruction power of variational autoencoders to 1) reconstruct video from music latent vector and, 2) reconstruct music from video latent vector. In layman terms, we are training a neural network that will try to guess the video activity just by listening background music, and also try to guess the background music just by seeing the video activities.

The joint training objective is $\mathcal{L}{(z_m,z_v)} = \beta \cdot\mathcal{L}{cross_recon} - \mathcal{L}{KL} + \gamma \cdot \mathcal{L}{matching}$, where $\beta$ and $\gamma$ control the weight of the cross reconstruction loss and the matching loss, respectively.

After training the model, they compared the model's performance with existing baselines and the results are as follows:

/img/content-blog-raw-blog-short-video-background-music-recommender-untitled-2.png

Conclusion: I don't make short videos myself but can easily imagine the difficulty in finding the right background music. If I have to do this task manually, I will try out 5-6 videos and select one that I like. But here, I will be assuming that my audience would also like this music. Moreover, feedback is not actionable because it will create kind of an implicit sub-conscious effect (because when I see a video, I mostly judge it at overall level and rarely notice that background music is the problem). So, this kind of recommender system will definitely help me in selecting a better background music. Excited to see this feature soon in TikTok, Youtube Shorts and other similar services.

· 13 min read
Sparsh Agarwal

An organization’s analytics strategy is how its people, processes, tools, and data work together to collect, store, and analyze data. Processes refers to how analytics are produced, consumed, and maintained. A more modern approach to analytics is intended to support greater business agility at scale. This requires faster data preparation from a wider variety of sources, rapid prototyping and analytics model building, and cross-team collaboration processes. Tools, or technologies, are the raw programs and applications used to prepare for and perform analyses, such as the provisioning, flow, and automation of tasks and resources. As an analytics strategy matures, the technologies used to implement it tend to move from monolithic structures to composable microservices. The last element is data. A modern analytics architecture supports a growing volume and variety of data sources, which may include data from data warehouses and data lakes—streaming data, relational databases, graph databases, unstructured or semi-structured data, text data, and images.

Analytics Past, Present, and Future

PastPresentFuture
This refers to an era of analytics starting in the 1990s and running through the mid-2000s. During this phase, organizations were able to consolidate mostly transactional data into a unified system, often a data warehouse, which limited end users’ ability to interact directly with the data due to technical and governance requirements.Starting in the late 2000s, organizations were forced to rethink how they used analytics, in no small part due to the explosion of data during this time. This was the era of “Big Data” and its infamous “ V’s”: volume, velocity, and variety.4 As organizations shifted their approach during this period, they unlocked diagnostic analytics, or the capability to answer “Why did it happen?”The Future of Analytics Is Converged. Converged analytics unifies advances in AI, streaming data, and related technologies into a seamless analytics experience for all users. This arrangement unlocks prescriptive analytics across an organization, allowing anyone to make data-driven decisions that answer important questions.
PeopleIT professionals were needed to kick off any data-based work by extracting data from a centralized, difficult-to-use source. This process could take multiple days, and the number of query requests could easy exceed the IT team’s ability to fulfill those requests—and the opportune time for new insights.If some change was needed to data collection or storage methods, it could easily take IT months to perform. The data analysis and modeling work could take nearly as long. Rank-and-file domain experts did have some access to data, through so-called self-service business intelligence (BI) features. However, due to the same speed and accessibility issues that technical professionals faced, it was often difficult for domain experts like line of business leaders to truly lead with data for decision making.It’s no coincidence that around the same time as Big Data emerged, so did the role of the data scientist. Compared with earlier roles like researcher or statistician, the data scientist blends quantitative and domain expertise with a greater degree of computational thinking. These skills became necessary both to handle the greater variety and volume of data sources and to update and deploy data and analytics models without the assistance of IT professionals.Whereas IT in the past sought to meticulously catalog and structure data to enter into a data warehouse, they no longer needed to always clean the data before collecting it; these analytics teams could focus on ease of use and speed to governed access.With these new workflows and organization structures in place, domain leaders are better able to lead with data: both via self-service BI tools and from frequent collaboration with data analysts, data scientists, and other data specialists.Statisticians and IT served information to business users at the inception of a wider analytics adoption; further into maturity, data analysts and scientists built systems where business users could self-serve insights. In a converged architecture, not only is the business user at the center, but their decision making is augmented by automation. Given this arrangement, there is more collaboration, more automation, and greater scale for data-driven insights as a result of the convergence of teams and workstreams. Teams can work cross-functionally and in parallel across different domains iterating the system to their needs with the raw time and human resources needed to create and maintain analytics products such as dashboards and models.
ProcessesIT professionals spent long periods of time gathering requirements for analytics projects before they could build or deploy solutions. The team meticulously catalogued sources of data used across the organization, from financial or point-of-sale systems to frequently used external datasets. As part of the warehousing process, it was decided which of these data sources to store and how to store them.Once deployed, data passed into the warehouse through an extract-transform-load process (ETL), where the data was copied from these various sources, cleaned and reshaped into the defined structure of the data warehouse, then inserted into production. In other words, data went through rigorous cleaning and preprocessing before use.To reach this data, users needed to write time-consuming ad hoc queries. Alternatively, particular data segments or summaries that were frequently requested by business users could be delivered via scheduled automation to reports, dashboards, and scorecards.As opposed to earlier analytics strategies, IT professionals now seek to collect data as is from any possible source of value. This data can be in a variety of formats, so few predefined rules or relationships are established for ingestion. Depending on the data size, data is processed in batch over discrete time periods, or in streams and events near real time. Because data cleaning is the last step, this process is sometimes referred to as extract-load-transform (ELT), as opposed to the ETL of earlier architectures. For data scientists and other technical professionals, faster access to more and more dynamic data better enables the rapid development of training sets of data for machine learning models. The ELT process allows for the construction of machine learning models, where computers are able to improve performance as more data is passed to them.As more data is collected and put into production, the importance of a data governance process typically grows, describing who has authority over data and how that data should be used. Similar approaches are necessary to audit how models are put into production and how they work.While perhaps using different means, the ends of older analytics approaches were the same: insights, whether historic or in support of future decisions, using governed data and processes. In the methods for doing so, however, infrastructure tended to bloat, either from fragile data storage jobs or increasingly complex data pipelines.Given the volume, velocity, and variety of data needed for prescriptive analytics, such monolithic, centralized approaches are less than optimal. Using the tools discussed in the next section, a converged architecture offers a more nimble approach for providing the right insights at the right time to users of all technical levels.Such democratization relies on quick deployment and adjustment of data products; optimizing production, for example, requires bringing more machine learning models to production faster and at scale. The practice of ModelOps is used to institute and govern such rapid production. These processes have become a necessity in rapidly changing business conditions; for example, as the COVID-19 pandemic made structural changes to the economy, many models lost their predictive edge in the face of fundamentally different data.
ToolsData warehouses implemented some new technologies relative to the traditional relational database model. Importantly, the data warehouse separated data into fact tables, where measurements were stored, and dimension tables, which contained descriptive attributes. Business users interacted with the data via reporting software to view static data summaries. These tended to rely on overnight batch jobs to update.In a more sophisticated architecture, analysts could take advantage of online analytical processing (OLAP) cubes. Usually relying on a star schema, OLAP let users query the data across dimensions during interactive sessions. For example, they could “slice and dice” or “roll up and drill down” on the data.By this point, end users had some autonomy in how they looked at and acted upon the data. Automated processes to inform business activities through data were also put into place, such as alerts when inventory or sales dropped below some threshold. Basic what-if analyses also helped business users evaluate decisions and plan for the future.That said, given the limited sources of data from the data warehouse, there were limited ways to customize and work with the data. While reporting and basic analytics were automated, end users operated largely without the assistance of models developed by statisticians. Although business intelligence and operations research seek to create value from data, too often these complementary tools were siloed.In 2011, James Dixon, then chief technology officer of Pentaho, coined the term data lake as the architecture needed to support the next level of analytics maturity. Dixon argued that because of the inherently rigid structures of data warehouses, getting value from the increasing volume and variety of data associated with Big Data was difficult. A data lake, “a repository of data stored in its natural/raw format,” was a better approach. In particular, this arrangement wasn’t suited to operate or capitalize on the expanding volume and variety of Big Data.The data lake is often powered by cloud computing for the benefits of reliability, redundancy, and scalability. Dominant cloud service providers include Amazon Web Services (AWS), Microsoft Azure, and Google Cloud Platform (GCP). Open source technologies like Hadoop and Spark are used to process and store massive datasets using parallel computing and distributed storage. Because this data is often unstructured, it may be stored in graph, document, or other non-relational databases.With the increasing volume and velocity of data, and the use of data lakes along with data warehouses to enable data-driven decisions, businesses needed better ways to scale and share business intelligence. One such path was through interactive, immersive exploration and visualization of the data, as pioneered with Spotfire. Other paths were through visual reports and dashboards, as used by not just Spotfire, but by Jaspersoft, Power BI, WebFOCUS, and many others. As BI tools matured, self-service capabilities and automation for end users also matured.If maintaining legacy analytics is like raising a thoroughbred, then developing converged analytics is like cultivating a school of goldfish. That is, the backend provisioning is no longer served by monolithic systems but rather by composable groups of microservices. This arrangement supports elastic and scalable analytics; composability makes it easier to adapt to changes driven in part by a growing volume and variety of data sources. In previous analytics approaches, the distinction between backward-facing BI and prediction-focused data science was clear. Under convergence, analytics at the edge is possible—automating analytic computations so they can be performed on non-centralized data generated by sensors, switches, and similar. With converged analytics, individuals no longer need to wait for data science teams to provide ad hoc deeper insights. They have all the data-driven insights at their fingertips, assisted by AI to quickly explore and make decisions. This isn’t just the case for back-office analysts: frontline workers can, for example, adjust how they interact with a customer given data retrieved about that customer at the time of that interaction.
DataDuring this period, data tended to be transactional, or related to sales and purchases. Take a point-of-sales (POS) system, for example. Each time a sale is made, information about what was sold, possibly to whom, is recorded in the POS system. Those records can be compiled into tables and ultimately processed into a data warehouse.Under this process, data is gathered from prespecified sources at prespecified times, such as a nightly POS extract. Not all data made its way to the data warehouse, especially in the earlier days of analytics—either because it was judged unimportant, or because it was not prioritized.Contemporary analytics expands the variety of data available and used: both structured tables and unstructured sources like natural language and images are available. On account of stream processing, refreshes of this data are available in minutes or even less. In particular, the data lake can accommodate real-time events such as IoT sensor readings, GPS signals, and online transactions as they happen.A primary feature of converged analytics is the blending of historical and real-time data. According to a study by Seagate and International Data Corporation (IDC), 30% of all data will be real time by 2025. In particular, IoT sensor readings, GPS signals, and online transactions as they happen are available for immediate analysis and modeling.
AgilityThe relatively rigid nature of the data warehouse made changes to the collection and dissemination of data difficult. Subsequently, business agility was limited. Business users could get historic data about the business through static reports (descriptive analytics). Through OLAP cubes, they could possibly even dig into the data to parse out cause and effect (diagnostic analytics). But without more immediate access to broader data, it was difficult to advance to predictive analytics, or the ability to ask: “What is going to happen?”This next phase in the evolution of analytics gets data-driven insights into the hands of end users quickly, with technology allowing them to interact with it on a deeper level. Data scientists are able to build machine learning systems that improve with more data. Using drag-and-drop tools, business users can process and analyze data without technical assistance. With cloud, automation, and streaming technologies, organizations have been better able to adapt to and plan for changing circumstances. That said, machine learning works only so long in production before the algorithm struggles to account for changes to the business and needs intervention. While data scientists undertake these predictive challenges, BI professionals and domain experts tend to operate solely in analyzing current or past data. The next generation of analytics architecture will further reflect organizational needs for greater collaboration among data scientists, BI and analytics teams, and business users and consumers of analytics insights.Earlier analytics tended to isolate skills and processes: technical versus highly technical roles, data collection versus deployment versus modeling, and so forth. Converged analytics promotes close collaboration between teams to rapidly model, deploy, and act on data. As data operations become decentralized, teams and individuals can rapidly mine and act on the analytics.In particular, the marriage of real-time data with machine learning and AI-infused BI allows any user to magnify their own domain knowledge with data-driven insights. These features square precisely with the definition of business agility as “innovation via collaboration to be able to anticipate challenges and opportunities before they occur.” With the support of converged analytics, any professional can detect and act on both challenges and opportunities at the moment of impact, rather than months later.

©️2021, RecoHut.

· 12 min read
Sparsh Agarwal

/img/content-blog-raw-blog-tools-for-building-recommender-systems-untitled.png

Recombee - Recommendation as a service API

Recombee is a Recommender as a Service with easy integration and Admin UI. It can be used in many domains, for example in media (VoD, news …), e-commerce, job boards, aggregators or classifieds. Basically, it can be used in any domain with a catalog of items that can be interacted by users. The users can interact with the items in many ways: for example view them, rate them, bookmark them, purchase them, etc. Both items and users can have various properties (metadata) that are also used by the recommendation models.

/img/content-blog-raw-blog-tools-for-building-recommender-systems-untitled-1.png

Here is the official tutorial series to get started.

Amazon Personalize - Self-service Platform to build and serve recommenders

Amazon Personalize is a fully managed machine learning service that goes beyond rigid static rule based recommendation systems and trains, tunes, and deploys custom ML models to deliver highly customized recommendations to customers across industries such as retail and media and entertainment.

/img/content-blog-raw-blog-tools-for-building-recommender-systems-untitled-2.png

It covers 6 use-cases:

Popular Use-cases

Popular Use-cases

Following are the hands-on tutorials:

  1. Data Science on AWS Workshop - Personalize Recommendationsp
  2. https://aws.amazon.com/blogs/machine-learning/creating-a-recommendation-engine-using-amazon-personalize/
  3. https://aws.amazon.com/blogs/machine-learning/omnichannel-personalization-with-amazon-personalize/
  4. https://aws.amazon.com/blogs/machine-learning/using-a-b-testing-to-measure-the-efficacy-of-recommendations-generated-by-amazon-personalize/

Also checkout these resources:

  1. https://www.youtube.com/playlist?list=PLN7ADELDRRhiQB9QkFiZolioeJZb3wqPE

Azure Personalizer - An API based service with Reinforcement learning capability

Azure Personalizer is a cloud-based API service that helps developers create rich, personalized experiences for each user of your app. It learns from customer's real-time behavior, and uses reinforcement learning to select the best item (action) based on collective behavior and reward scores across all users. Actions are the content items, such as news articles, specific movies, or products. It takes a list of items (e.g. list of drop-down choices) and their context (e.g. Report Name, User Name, Time Zone) as input and returns the ranked list of items for the given context. While doing that, it also allows feedback submission regarding the relevance and efficiency of the ranking results returned by the service. The feedback (reward score) can be automatically calculated and submitted to the service based on the given personalization use case.

/img/content-blog-raw-blog-tools-for-building-recommender-systems-untitled-4.png

You can use the Personalizer service to determine what product to suggest to shoppers or to figure out the optimal position for an advertisement. After the content is shown to the user, your application monitors the user's reaction and reports a reward score back to the Personalizer service. This ensures continuous improvement of the machine learning model, and Personalizer's ability to select the best content item based on the contextual information it receives.

Following are some of the interesting use cases of Azure Personalizer:

  1. Blog Recommender [Video tutorial, GitHub]
  2. Food Personalizer [Video tutorial, Slideshare, Code Blog]
  3. Coffee Personalizer [GitHub, Video tutorial]
  4. News Recommendation
  5. Movie Recommendation
  6. Product Recommendation
  7. Intent clarification & disambiguation: help your users have a better experience when their intent is not clear by providing an option that is personalized.
  8. Default suggestions for menus & options: have the bot suggest the most likely item in a personalized way as a first step, instead of presenting an impersonal menu or list of alternatives.
  9. Bot traits & tone: for bots that can vary tone, verbosity, and writing style, consider varying these traits.
  10. Notification & alert content: decide what text to use for alerts in order to engage users more.
  11. Notification & alert timing: have personalized learning of when to send notifications to users to engage them more.
  12. Dropdown Options - Different users of an application with manager privileges would see a list of reports that they can run. Before Personalizer was implemented, the list of dozens of reports was displayed in alphabetical order, requiring most of the managers to scroll through the lengthy list to find the report they needed. This created a poor user experience for daily users of the reporting system, making for a good use case for Personalizer. The tooling learned from the user behavior and began to rank frequently run reports on the top of the dropdown list. Frequently run reports would be different for different users, and would change over time for each manager as they get assigned to different projects. This is exactly the situation where Personalizer’s reward score-based learning models come into play.
  13. Projects in Timesheet - Every employee in the company logs a daily timesheet listing all of the projects the user is assigned to. It also lists other projects, such as overhead. Depending upon the employee project allocations, his or her timesheet table could have few to a couple of dozen active projects listed. Even though the employee is assigned to several projects, particularly at lead and manager levels, they don’t log time in more than 2 to 3 projects for a few weeks to months.
    1. Reward Score Calculation

Google Recommendation - Recommender Service from Google

https://cloudx-bricks-prod-bucket.storage.googleapis.com/6a0d4afb1778e55d54cb7d66382a4b25f8748a50a93f3c3403d2a835aa166f3d.svg

Abacus.ai - Self-service Platform at cheaper price

It uses multi-objective, real-time recommendations models and provides 4 use-cases for fasttrack train-&-deploy process - Personalized recommendations, personalized search, related items and real-time feed recommendations.

/img/content-blog-raw-blog-tools-for-building-recommender-systems-untitled-5.png

Here is the hands-on video tutorial:

https://youtu.be/7hTKL73f2yA

Nvidia Merlin - Toolkit with GPU capabilities

Merlin empowers data scientists, machine learning engineers, and researchers to build high-performing recommenders at scale. Merlin includes tools that democratize building deep learning recommenders by addressing common ETL, training, and inference challenges. Each stage of the Merlin pipeline is optimized to support hundreds of terabytes of data, all accessible through easy-to-use APIs. With Merlin, better predictions than traditional methods and increased click-through rates are within reach.

End-to-end recommender system architecture. FE: feature engineering; PP: preprocessing; ETL: extract-transform-load.

End-to-end recommender system architecture. FE: feature engineering; PP: preprocessing; ETL: extract-transform-load.

/img/content-blog-raw-blog-tools-for-building-recommender-systems-untitled-7.png

TFRS - Open-source Recommender library built on top of Tensorflow

Built with TensorFlow 2.x, TFRS makes it possible to:

/img/content-blog-raw-blog-tools-for-building-recommender-systems-untitled-8.png

Following is a series of official tutorial notebooks:-

TensorFlow Recommenders: Quickstart

Elliot - An end-to-end framework good for recommender system experiments

Elliot is a comprehensive recommendation framework that aims to run and reproduce an entire experimental pipeline by processing a simple configuration file. The framework loads, filters, and splits the data considering a vast set of strategies (13 splitting methods and 8 filtering approaches, from temporal training-test splitting to nested K-folds Cross-Validation). Elliot optimizes hyperparameters (51 strategies) for several recommendation algorithms (50), selects the best models, compares them with the baselines providing intra-model statistics, computes metrics (36) spanning from accuracy to beyond-accuracy, bias, and fairness, and conducts statistical analysis (Wilcoxon and Paired t-test). The aim is to provide the researchers with a tool to ease (and make them reproducible) all the experimental evaluation phases, from data reading to results collection.

/img/content-blog-raw-blog-tools-for-building-recommender-systems-untitled-9.png

RecBole - Another framework good for recommender system model experiments

RecBole is developed based on Python and PyTorch for reproducing and developing recommendation algorithms in a unified, comprehensive and efficient framework for research purpose. It can be installed from pip, Conda and source, and easy to use. It includes 65 recommendation algorithms, covering four major categories: General Recommendation, Sequential Recommendation, Context-aware Recommendation, and Knowledge-based Recommendation, which can support the basic research in recommender systems.

/img/content-blog-raw-blog-tools-for-building-recommender-systems-untitled-10.png

Features:

  • General and extensible data structureWe deign general and extensible data structures to unify the formatting and usage of various recommendation datasets.
  • Comprehensive benchmark models and datasetsWe implement 65 commonly used recommendation algorithms, and provide the formatted copies of 28 recommendation datasets.
  • Efficient GPU-accelerated executionWe design many tailored strategies in the GPU environment to enhance the efficiency of our library.
  • Extensive and standard evaluation protocolsWe support a series of commonly used evaluation protocols or settings for testing and comparing recommendation algorithms.

The Microsoft Recommenders repository is an open source collection of python utilities and Jupyter notebooks to help accelerate the process of designing, evaluating, and deploying recommender systems. The repository was initially formed by data scientists at Microsoft to consolidate common tools and best practices developed from working on recommender systems in various industry settings. The goal of the tools and notebooks is to show examples of how to effectively build, compare, and then deploy the best recommender solution for a given scenario. Contributions from the community have brought in new algorithm implementations and code examples covering multiple aspects of working with recommendation algorithms.

/img/content-blog-raw-blog-tools-for-building-recommender-systems-untitled-11.png

Surprise - An open-source library with easy api and powerful models

Surprise is a Python scikit for building and analyzing recommender systems that deal with explicit rating data.

Surprise was designed with the following purposes in mind:

Spotlight - Another open-source library

Spotlight uses PyTorch to build both deep and shallow recommender models. By providing both a slew of building blocks for loss functions (various pointwise and pairwise ranking losses), representations (shallow factorization representations, deep sequence models), and utilities for fetching (or generating) recommendation datasets, it aims to be a tool for rapid exploration and prototyping of new recommender models.

/img/content-blog-raw-blog-tools-for-building-recommender-systems-untitled-12.png

Here is a series of hands-on tutorials to get started.

Vowpal Wabbit - library with reinforcement learning features

Vowpal Wabbit is an open source machine learning library, extensively used by industry, and is the first public terascale learning system. It provides fast, scalable machine learning and has unique capabilities such as learning to search, active learning, contextual memory, and extreme multiclass learning. It has a focus on reinforcement learning and provides production ready implementations of Contextual Bandit algorithms. It was developed originally at Yahoo! Research, and currently at Microsoft Research. Vowpal Wabbit sees significant innovation as a research to production vehicle for Microsoft Research.

/img/content-blog-raw-blog-tools-for-building-recommender-systems-untitled-13.png

For most applications, collaborative filtering yields satisfactory results for item recommendations; there are however several issues that arise that might make it difficult to scale up a recommender system.

  • The number of features can grow quite large, and given the usual sparsity of consumption datasets, collaborative filtering needs every single feature and datapoint available.
  • For new data points, the whole model has to be re-trained

Vowpal Wabbit’s matrix factorization capabilities can be used to build a recommender that is similar in spirit to collaborative filtering but that avoids the pitfalls that we mentioned before.

Following are the three introductory hands-on tutorials on building recommender systems with vowpal wabbit:

  1. Vowpal Wabbit Deep Dive - A Content-based Recommender System using Microsoft Recommender Library
  2. Simulating Content Personalization with Contextual Bandits
  3. Vowpal Wabbit, The Magic Recommender System!

DLRM - An open-source scalable model from Facebook's AI team, build on top of PyTorch

DLRM advances on other models by combining principles from both collaborative filtering and predictive analytics-based approaches, which enables it to work efficiently with production-scale data and provide state-of-art results.

In the DLRM model, categorical features are processed using embeddings, while continuous features are processed with a bottom multilayer perceptron (MLP). Then, second-order interactions of different features are computed explicitly. Finally, the results are processed with a top MLP and fed into a sigmoid function in order to give a probability of a click.

/img/content-blog-raw-blog-tools-for-building-recommender-systems-untitled-14.png

Following are the hands-on tutorials:

  1. https://nbviewer.jupyter.org/github/gotorehanahmad/Recommendation-Systems/blob/master/dlrm/dlrm_main.ipynb
  2. Training Facebook's DLRM on the digix dataset

References

  1. https://elliot.readthedocs.io/en/latest/
  2. https://vowpalwabbit.org/index.html
  3. https://abacus.ai/user_eng
  4. https://azure.microsoft.com/en-in/services/cognitive-services/personalizer/
  5. https://aws.amazon.com/personalize/
  6. https://github.com/facebookresearch/dlrm
  7. https://www.tensorflow.org/recommenders
  8. https://magento.com/products/product-recommendations
  9. https://cloud.google.com/recommendations
  10. https://www.recombee.com/
  11. https://recbole.io/
  12. https://github.com/microsoft/recommenders
  13. http://surpriselib.com/
  14. https://github.com/maciejkula/spotlight
  15. https://vowpalwabbit.org/tutorials/contextual_bandits.html
  16. https://github.com/VowpalWabbit/vowpal_wabbit/wiki
  17. https://vowpalwabbit.org/tutorials/cb_simulation.html
  18. https://vowpalwabbit.org/rlos/2021/projects.html
  19. https://vowpalwabbit.org/rlos/2020/projects.html
  20. https://getstream.io/blog/recommendations-activity-streams-vowpal-wabbit/
  21. https://samuel-guedj.medium.com/vowpal-wabbit-the-magic-58b7f1d8e39c
  22. https://vowpalwabbit.org/neurips2019/
  23. https://github.com/VowpalWabbit/neurips2019
  24. https://getstream.io/blog/introduction-contextual-bandits/
  25. https://www.youtube.com/watch?v=CeOcNK1xSSA&t=72s
  26. https://vowpalwabbit.org/blog/rlos-fest-2021.html
  27. https://github.com/VowpalWabbit/workshop
  28. https://github.com/VowpalWabbit/workshop/tree/master/aiNextCon2019
  29. Blog post by Nasir Mirza. Azure Cognitive Services Personalizer: Part One. Oct, 2019.
  30. Blog post by Nasir Mirza. Azure Cognitive Services Personalizer: Part Two. Oct, 2019.
  31. Blog post by Nasir Mirza. Azure Cognitive Services Personalizer: Part Three. Dec, 2019.
  32. Microsoft Azure Personalizer Official Documentation. Oct, 2020.
  33. Personalizer demo.
  34. Official Page.
  35. Blog Post by Jake Wong. Get hands on with the Azure Personalizer API. Aug, 2019.
  36. Medium Post.
  37. Blog Post.
  38. Git Repo.
  39. https://youtu.be/7hTKL73f2yA
  40. Deep-Learning Based Recommendation Systems — Learning AI
  41. Evaluating Deep Learning Models with Abacus.AI – Recommendation Systems
  42. https://aws.amazon.com/blogs/machine-learning/pioneering-personalized-user-experiences-at-stockx-with-amazon-personalize/
  43. https://aws.amazon.com/blogs/machine-learning/category/artificial-intelligence/amazon-personalize/
  44. https://d1.awsstatic.com/events/reinvent/2019/REPEAT_1_Build_a_content-recommendation_engine_with_Amazon_Personalize_AIM304-R1.pdf
  45. https://aws.amazon.com/blogs/aws/amazon-personalize-real-time-personalization-and-recommendation-for-everyone/
  46. https://d1.awsstatic.com/events/reinvent/2019/REPEAT_1_Accelerate_experimentation_with_personalization_models_AIM424-R1.pdf
  47. https://d1.awsstatic.com/events/reinvent/2019/REPEAT_1_Personalized_user_engagement_with_machine_learning_AIM346-R1.pdf
  48. https://github.com/aws-samples/amazon-personalize-samples
  49. https://github.com/aws-samples/amazon-personalize-automated-retraining
  50. https://github.com/aws-samples/amazon-personalize-ingestion-pipeline
  51. https://github.com/aws-samples/amazon-personalize-monitor
  52. https://github.com/aws-samples/amazon-personalize-data-conversion-pipeline
  53. https://github.com/james-jory/segment-personalize-workshop
  54. https://github.com/aws-samples/amazon-personalize-samples/tree/master/next_steps/workshops/POC_in_a_box
  55. https://github.com/Imagination-Media/aws-personalize-magento2
  56. https://github.com/awslabs/amazon-personalize-optimizer-using-amazon-pinpoint-events
  57. https://github.com/aws-samples/amazon-personalize-with-aws-glue-sample-dataset
  58. https://github.com/awsdocs/amazon-personalize-developer-guide
  59. https://github.com/chrisking/NetflixPersonalize
  60. https://github.com/aws-samples/retail-demo-store
  61. https://github.com/aws-samples/personalize-data-science-sdk-workflow
  62. https://github.com/apac-ml-tfc/personalize-poc
  63. https://github.com/dalacan/personalize-batch-recommendations
  64. https://github.com/harunobukameda/Amazon-Personalize-Handson
  65. https://www.sagemakerworkshop.com/personalize/
  66. https://github.com/lmorri/vodpocinabox
  67. https://github.com/awslabs/unicornflix
  68. https://www.youtube.com/watch?v=r9J3UZmddC4&t=966s
  69. https://www.youtube.com/watch?v=kTufCK76Yus&t=1436s
  70. https://www.youtube.com/watch?v=hY_XzglTkak&t=66s
  71. https://business.adobe.com/lv/summit/2020/adobe-sensei-powers-magento-product-recommendations.html
  72. https://magento.com/products/product-recommendations
  73. https://docs.magento.com/user-guide/marketing/product-recommendations.html
  74. https://vod.webqem.com/detail/videos/magento-commerce/video/6195503645001/magento-commerce---product-recommendations?autoStart=true&page=1
  75. https://blog.adobe.com/en/publish/2020/11/23/new-ai-capabilities-for-magento-commerce-improve-retail.html#gs.yw6mtq
  76. https://developers.google.com/recommender/docs/reference/rest
  77. https://www.youtube.com/watch?v=nY5U0uQZRyU&t=6s