UberEats Personalization
Food Discovery with Uber Eats: Recommending for the Marketplace
Uber Eats is recommending ready-to-deliver food items to users on the mobile app home screen using graph learning methods to make the user experience more seamless and easy-to-navigate.
Choice is fundamental to the Uber Eats experience. At any given location, there could be thousands of restaurants and even more individual menu items for an eater to choose from. Many factors can influence their choice. For example, the time of day, their cuisine preference, and current mood can all play a role. At Uber Eats, we strive to help eaters find the exact food they want as effortlessly as possible. We approach this task through search and recommendation technologies, and recent advances in machine learning.
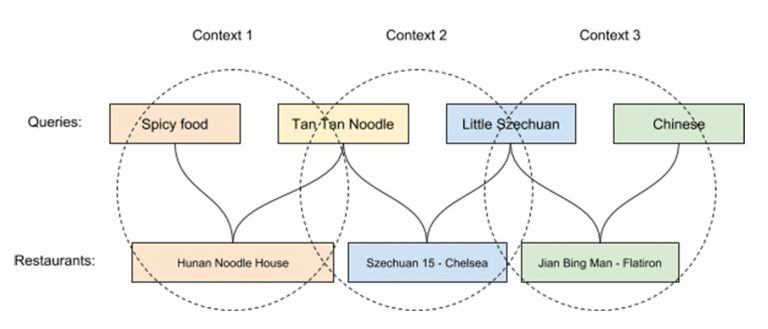
From search results to the list of restaurants and explicit recommendations on the app’s homescreen, we tailor the selection and ranking of restaurants to our understanding of what our eaters crave. For example, an eater may notice that if they order a lot of spicy Szechuan food, they will begin to see more Chinese restaurants selling spicy food in the app. At the same time, additional Thai, Japanese, or other Asian recommendations might show up, too.
Early days
When we launched the first version of the Uber Eats restaurant ranking and recommender system, we were optimizing for a single objective: the eater’s probability to order from a restaurant (eater conversion rate). Different types of supervised machine learning models and learning to rank algorithms were built to achieve that purpose. We observed significant business metric lifts when we switched from an offline and non-personalized model to an online and personalized model, validating the importance of real-time features and customization.
However, we soon realized that optimizing only for eater conversion did not provide the best overall experience. As we continued to sign-up restaurant-partners for our platform, we found that new restaurants, even well-known and popular ones, were not getting the same volume of orders as we expected. As restaurant-partners make up one side of our three-sided marketplace, we began exploring how to ensure that all restaurants on our platform get their fair share of exposure, which should result in more orders.
We also needed to optimize for the health and efficiency of the overall marketplace, which also has the side-benefit of exposing eaters to a more diverse selection of restaurants. Since then, we have evolved our system, as we discuss later in the article.
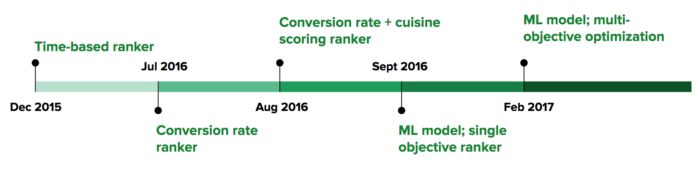
This timeline illustrates our journey and the changes involved in improving our system.
Query Understanding Engine
Although query understanding is a common problem for different types of search engines, it poses unique challenges and additional opportunities when faced with food and restaurants. A restaurant may be categorized for a specific cuisine type, but may also include other types of cuisine on its menu. Individual food items can share enough similarities to make them relevant as results in a search query, although their names may be completely different. And the geographical bounding for the set of potential results creates a limitation, which can lead to no obvious responses to a query.
Typically, an eater specifies their intent through text in the form of a search query in the Uber Eats app. From the moment an eater enters a query, we try to understand their intent based on our knowledge of food organized as a graph, and then use a learned representation of eater intent to expand on this query, with the idea of surfacing the most relevant results.
Understanding intent
The first question we try to understand when helping our customers discover the perfect meal is: what is the eater looking for? For example, some engineers in our office order bubble tea for a midday pick-me-up. When they open the Uber Eats app, their intent is clear and they know they only want bubble tea. However, when eaters open the app to order lunch or dinner, their intentions may not be as clear. An eater might have a general cuisine type in mind, like Asian or American, but need help deciding whether to go with Chinese or Japanese, sandwiches or barbecue.
Alternatively, an eater might have a certain type of food in mind, but choose something else while browsing the app. For example, an eater might search for udon, but end up ordering soba. In this case, the eater may have been looking for something similar to udon, such as soba and ramen, instead of only being interested in udon. As humans, it might seem obvious; Udon and soba are somewhat similar, Chinese and Japanese are both Asian cuisines. However, machines have a more difficult time understanding these similarities only based on the textual information. In fact, a lot of work goes into training them to make these types of intelligent decisions on the semantic level.
Build a knowledge graph
The classic approach of query understanding through text matching with natural language processing (NLP) works if the eater intent is clear and specific. But where the intent is ambiguous, such as the scenarios outlined above, applying classic NLP approaches alone is not sufficient. Of the alternative approaches we can take, most require establishing an intelligent understanding of the entities within the food domain by building a knowledge base. Many companies spend considerable time building up knowledge bases across several domains, with Google’s Knowledge Vault being one of the most well-known.
At Uber, we are building a food-focused knowledge base to enable better understanding of food-related queries.
In the food domain, we deal with heterogeneous entities such as restaurants, cuisines, and menu items. Since these entities have natural relationships, we can model them as a graph. A graph is the most common form used to express complex and intricate relationships between entities in a knowledge base. This graph makes modeling and linking data much more intuitive.
Establishing a knowledge base can be a very challenging process. To effectively leverage data, a knowledge base needs to be in a semi-structured form: generic and flexible enough to easily add more facts, but specific enough to be more than just a blob of data. Achieving this balance requires building an ontology, or language, to describe the graph, including properties of different entities and the relationships between them.
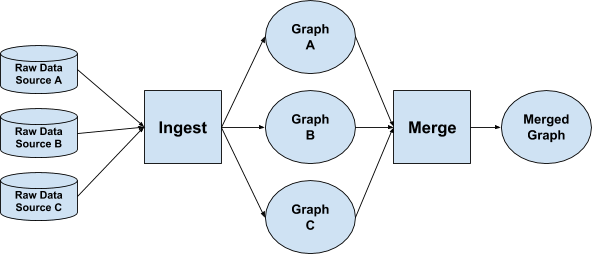
A high-level view of a graph data pipeline shows how graphs are created with multiple data sources.
With this ontology, our offline pipelines can transform data consumed from multiple sources to conform with its definitions. Once the ingest component of the offline pipeline transforms the data to fit our ontology, a set of classifiers are then run to de-duplicate the data and make cross-source connections in order to leverage the graph’s abstraction power. For example, this stage involves establishing that a given restaurant on Foursquare, one of our data sources, is the same as the restaurant in our internal account data. Finally, once all these stages are complete, the data is stored in such a way that makes it queryable in real time with low latency.
With an established graph, our next task involves leveraging it to optimize an eater’s search results. Offline, we can extensively annotate restaurants and menu items with very descriptive tags. Online, we can rewrite the eater’s query in real time to optimize the quality of the returned results. We combine both approaches to guarantee high accuracy and low latency.
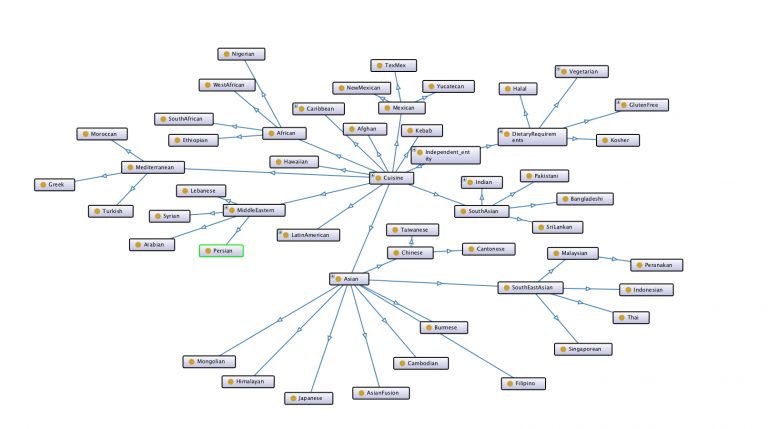
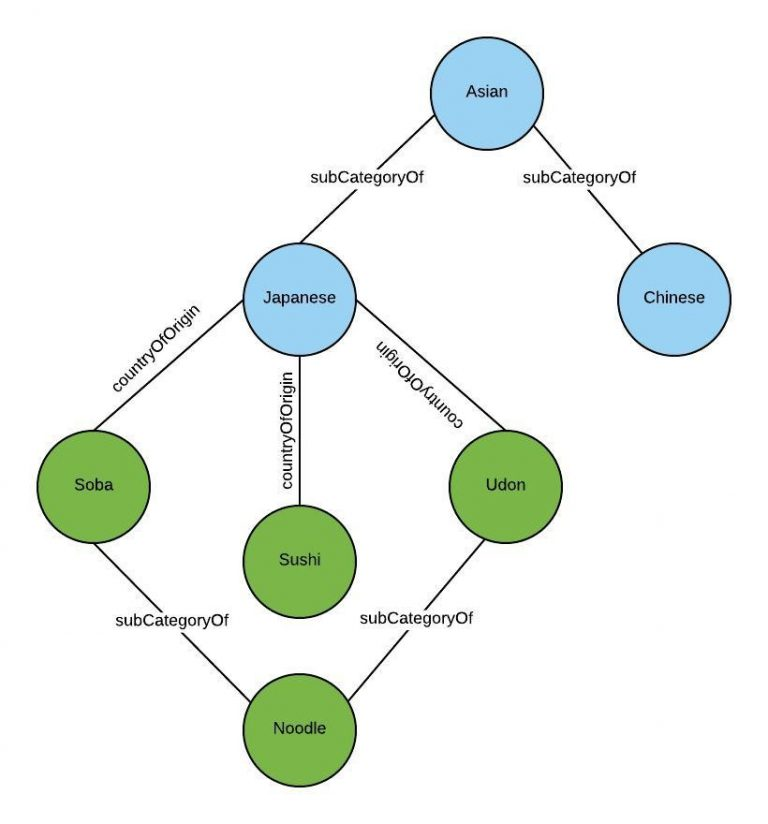
Both offline tagging and online query rewriting require a semantic understanding of entities in our data and how they relate to one another. To build a rich set of tags and annotations at the restaurant and item level, we need to understand the difference between a cuisine and a dish type and how certain cuisines have associations with countries and sub-geographies. Our graph enables us to better understand how these different dishes and cuisines relate. For instance, if an eater queries for “Asian” cuisine, the graph can infer that “Chinese” and “Japanese” are a subset of “Asian,” and surface the restaurants appropriately.
If it were handling a query for “udon,” the graph would use online query rewriting to expand the search to also include related terms such as “ramen,” “soba,” and “Japanese”; however, if restaurants are not properly tagged in our underlying database, it will be very difficult to ensure total recall of all relevant restaurants. This is where the offline tagging comes into play and surfaces restaurants that sell udon or udon-related dishes to the eater as quickly as possible.
Additionally, we use the graph to solve another common problem of search: the zero result problem. A lack of results commonly occurs when an eater searches for a restaurant that is not on our platform, or any matching restaurants are out of the eater’s delivery radius. For example, “Shanghai Dumpling King” is available for eaters with a delivery address set to San Francisco, but this restaurant would become unavailable to an eater with a delivery address in San Jose.
Instead of simply returning no results, we leverage the cross-domain nature of the graph to surface similar restaurants in the area. Our graph not only maps nodes to cuisines, but also to restaurants in the area. These restaurant nodes are linked to their respective cuisines, which lets us surface other restaurants in the area with similar cuisines as suggested results.
Recommendation Engine
Candidate generation and Ranking
The Uber Eats recommendation system can be broken down into two phases: candidate generation and personalized ranking.
The candidate generation component generates relevant candidates, in other words, dishes, and restaurants, in a scalable fashion. They needed to make this phase highly scalable to enable pre-filtering of the huge and ever-growing number of dish and restaurant options on the platform. Pre-filtering can be based on factors such as geographical location, so they do not recommend a restaurant to a user that is out of its delivery range.
The second component of this system, the personalized ranker, is a fully-fledged ML model that ranks the pre-filtered dish and restaurant candidates based on additional contextual information, such as the day, time, and current location of the user when they open the Uber Eats app. An example of a recurring order pattern the model can learn to capture includes ordering certain types of food on specific days of the week or different types of dishes for lunch and dinner.
Representation learning
They used Graph Neural Network (GNN) to encode users, food items, and restaurants.
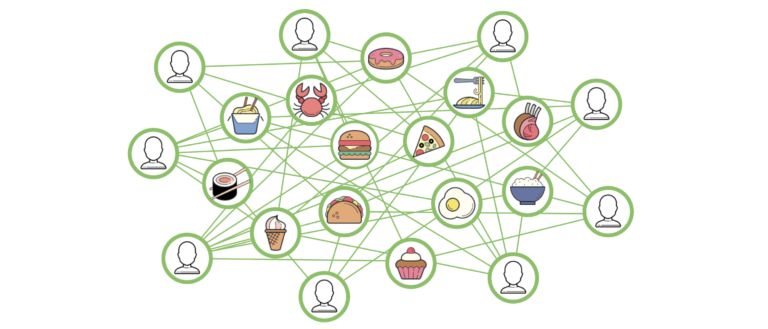
Bi-partite graph
In order to use GNNs to improve Uber Eats recommendations, they created two bipartite graphs: one that represents users and dishes as nodes with edges representing the number of times a user ordered a specific dish, and a second graph which represents users and restaurants as nodes, and edges represent how many times a user ordered from a specific restaurant.
Vanilla GraphSAGE
They used GraphSAGE, a specific flavor of GNN in which the aggregation function is a max or mean pooling after a projection, for their modeling starting point because of its strong scalability. In this GNN, the combination of node information and neighbor information is obtained through concatenation. Additionally, GraphSAGE adopts a sampling strategy to constrain the number of nodes sampled at one and two-hop distance from the node of which we want to obtain the representation, making it possible to scale learning to graphs with billions of nodes and providing even better suggestions.
Modified GraphSAGE - Additional projection layer
In order to apply GraphSAGE to bipartite graphs, they had to modify it in a few ways.
First, since each node type may have different features, they needed to add an additional projection layer to the GNN. This layer projects the input features into a vector of the same size depending on the type of input node (user, restaurant, or dish). For instance, since dishes can be represented by the word embeddings from their descriptions or features of their associated images, and restaurants can have basic features related to their menu and cuisine offerings, their feature size is different, but the projection layer needs to project them in a space of the same size.
Modified GraphSAGE - Weighted edges
Moreover, GraphSAGE only considers graphs with binary edges, but in their case, the edges need to be weighted to include information about the number of times a user orders from a restaurant or a specific dish and the rating given by a user to a dish, as these are very important signals. For this issue, they introduced a few new concepts to add weights on the edges. The most impactful change was adopting a hinge loss, a type of loss that fits the ranking of items with respect to the user better than using binary edges.

Given a user u ordering a dish v at least one time, a weighted edge between them exists in the graph. If we want to predict a score for this pair of nodes that is higher than the score that we predict for the same node u and a randomly selected node n that is not connected to it (a dish the user never ordered), the difference between the scores should be greater than a margin.
Modified GraphSAGE - Low rank positives
The problem with this loss is that edges with a high weight and edges with a low weight are treated interchangeably, which doesn’t work well given the difference between a dish a user ordered once and a dish a user ordered ten times. For this reason, we introduced the concept of low-rank positives in the loss.
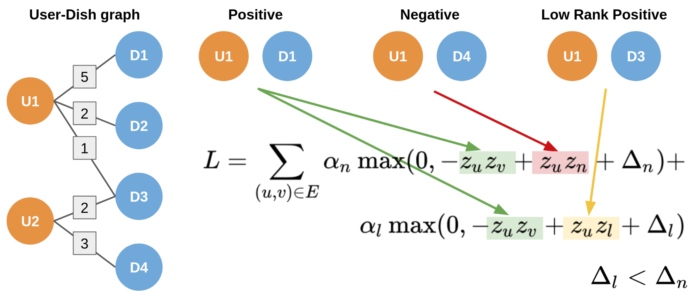
Uber Eats recommendation system leverages max-margin loss augmented with low rank positives.
Given a positive edge <u, v>, a low rank positive is an edge <u, l> where the node u is the same, but the node l is different from v and the weight on the edge of <u, l> is lower than the weight on <u, v>. They added a second piece to the loss to ensure that edges with higher weight are ranked higher than the edges with lower weight with a margin, which they set to a value lower than , the margin for the negative samples. Both pieces of the loss have a multiplier, a hyper-parameter controlling the relative importance of both the negative sample part of the loss and the low rank positive part of the loss.
Offline evaluation
Once we obtain the representations of the nodes using the trained GNN, we can use the distance between the node representations to approximate the similarity between them. Specifically, they added the dot product and cosine similarity of user and items to both our dish and restaurant recommender systems as features, and tested them both offline and online to determine their accuracy.
To evaluate how useful the embeddings are for our recommending task, we trained the model on four months of historical data up to a specific split date. We then tested the model performance on recommending dishes and restaurants using order data from the ten days following the split date. Specifically, we computed the cosine similarity between a user and all the dish and restaurant embeddings in the city and computed the rank of the dish and restaurant that the user ordered. During the experiment we observed a performance boost of over ~20 percent compared to the existing production model on metrics like Mean Reciprocal Rank, Precision@K, and NDCG.
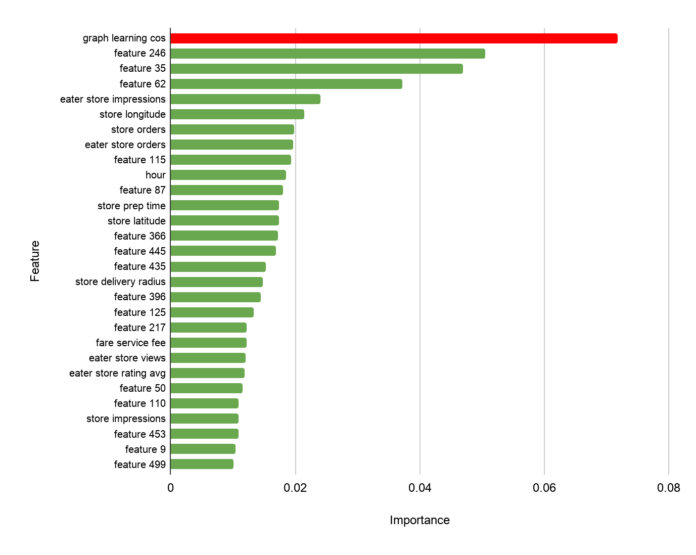
The improved performance obtained from the embeddings trained with graph learning convinced us to add them as features in our Uber Eats recommendation system’s personalized ranking model. When we trained the personalized ranking model with the graph learned embeddings similarity feature, we saw a 12 percent boost in AUC compared to the existing productionized baseline model, leading to improved recommendations for users.
Moreover, analyzing the impact of the feature on our predictions, we saw that the graph learning similarity feature was by far the most influential feature in the recommendation model. This gave us confidence that the graph learned embeddings captured more information than any existing feature in our system, as depicted in the figure below:
Online evaluation
Given the offline results, they felt comfortable rolling out the new model in an online experiment. They conducted an A/B test in San Francisco and observed a substantial improvement in engagement and click-through rate when leveraging the graph learning feature compared to the previous production model, demonstrating that the surfaced dishes predicted by their model appealed more to Uber Eats users.
Data and training pipeline
Once we determined the positive impact of graph learning on our recommendation system, we built a scalable data pipeline to both train models and obtain predictions in a real-time production environment.
We train separate models for each city, as their graphs are only loosely connected.
In order to do this, we used anonymized, aggregated order data from the past several months available and designed a four-step data pipeline to transform the data into the networkx graph format that is required to train our models. The pipeline also extracts aggregated features not directly available in the raw order data, like the total number of times users ordered dishes, which determines the weight of the graph’s edges.
Additionally, the pipeline is also capable of creating graphs for older time frames, which can be used for offline analysis. The overall pipeline is depicted in the figure below:
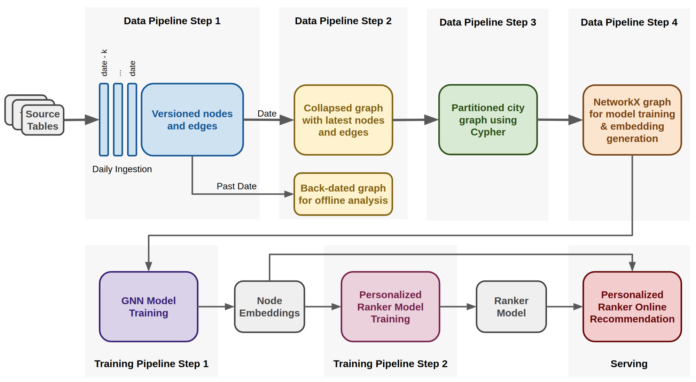
In the first step of the pipeline, multiple jobs pull data from Apache Hive tables, ingesting it into HDFS as Parquet files containing nodes and edges information respectively. Each node and edge has properties that are versioned by timestamp, which is needed for constructing back-dated graphs.
In the second step, we retain the most recent properties of each node and edge given a specific date and store them in HDFS using Cypher format. When training production models, the specified date is the current one, but the process is the same also if past dates are specified for obtaining back-dated graphs.
The third step involves using the Cypher query language in an Apache Spark execution engine to produce multiple graphs partitioned by city.
Finally, in the fourth step we convert the city graphs into the networkx graph format, which is consumed during the model training and embedding generation process, which are implemented as TensorFlow processes and executed on GPUs.
The generated embeddings are stored in a lookup table from which they can be retrieved by the ranking model when the app is opened and a request for suggestions is issued.
Visualizing learned embeddings
In order to provide an example capable of characterizing what is learned by our graph representation learning algorithm, we show how the representation of a hypothetical user changes over time.
Assuming we have a new user on Uber Eats who ordered a Chicken Tandoori and a Vegetable Biryani (both Indian dishes), we obtain a representation for such user at this moment in time.
The same user later orders a few other dishes, including Half Pizza, Cobb Salad, Half Dozen Donuts, Ma Po Tofu ( a Chinese dish), Chicken Tikka Masala, and Garlic Naan (three Indian dishes). We obtain a representation of the user after these additional orders and we compute the distance of those two representations with respect to the most popular dishes from different cuisine types and display it in the figure below using the explicit axes technique introduced in Parallax: Visualizing and Understanding the Semantics of Embedding Spaces via Algebraic Formulae.
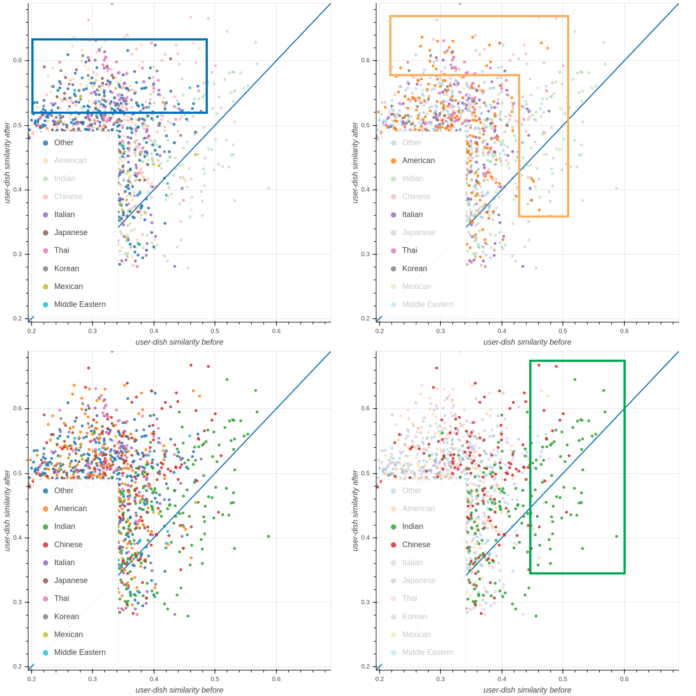
We compared the representation of a hypothetical user before and after ordering dishes and compared them to popular dishes from different cuisines. The four plots highlight dishes belonging to four different subsets of cuisines. The x-axis measures how much a dish is similar to the user representation before ordering additional dishes, while the y-axis measures how a dish is similar to the user representation after ordering additional dishes.
In the bottom-left section of the figure, clear patterns emerge. The first pattern is highlighted in the green box in the bottom right: the dishes closest to the user representation before the additional orders are almost all Indian dishes (green dots) as expected given the fact that the initial orders were both of Indian food, but also some Chinese dishes end up ranked high on the x-axis, suggesting a second-order correlation between these cuisine types (i.e., users who ordered many Indian dishes also ordered Chinese ones). Chinese dishes also rank pretty high on the y-axis, suggesting that ordering Ma Po Tofu influenced the model to suggest more Chinese dishes.
In the top right section of the figure, a second pattern is highlighted in the orange box: American, Italian, Thai, and Korean dishes are selected, showing how they are much closer to the user representation after the user ordered additional dishes. This is due to both ordering Pizza, Doughnuts, and the Cobb Salad, but also due to second-order effects from the increase of Chinese suggestions, as users ordering Chinese dishes are also more likely to order Thai and Korean.
Finally, in the top left section of the image, a third pattern is highlighted in the blue box: all the cuisines that are not among the top three closest to both user representations ended up increasing their similarity substantially after their subsequent orders, which suggests that the model learned that this specific user might like for new cuisine suggestions to be surfaced.
Extensions
As discussed, graph learning is not just a compelling research direction, but is already a compelling option for recommendation systems deployed at scale.
While graph learning has led to significant improvements in recommendation quality and relevancy, we still have more work to do to enhance our deployed system. In particular, we are exploring ways to merge our dish and restaurant recommendation tasks, which are currently separate, because we believe they could reinforce each other. Over time, we plan to move from two bipartite graphs to one single graph that contains nodes of all the entities. This will require additional work on the loss and aggregation function to work properly, but we believe it will provide additional information to both tasks leveraging common information.
Another limitation we want to tackle is the problem of recommending reasonable items to users even in situations with data scarcity, such as in cities that are new to the Uber Eats platform. We are conducting research in this direction through the use of meta graph learning with encouraging results.
Multi-objective Optimization: Recommending for the marketplace
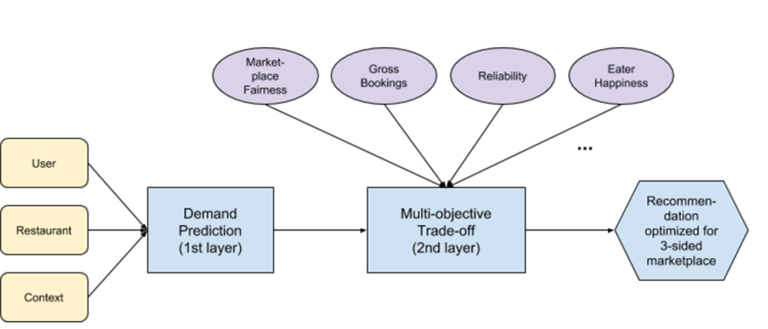
We generate these recommendations based on both our modeling of each user’s taste preference through machine learning and our semantic understanding of food types. These recommendations also serve to support the overall health of the Uber Eats marketplace. Through multi-objective optimization, we can help eaters discover a diverse array of restaurants and ensure that our restaurant-partners receive a fair amount of exposure in the app based on eater interest.
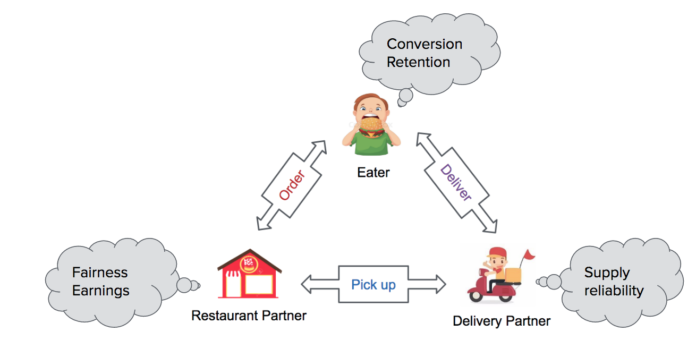
All sides of this marketplace are equally important to ensure a seamless Uber Eats experience. If there are not enough eaters placing orders, restaurants will not want to participate. If there are not enough restaurants, the selection decreases and fewer eaters will want to order from the platform. If orders decreased, delivery-partners will not be incentivized to sign up since they might make less income. With too few delivery-partners, delivery times could increase for eaters (making food colder when it arrived), affecting the overall experience.
On the other hand, if most orders are concentrated to a certain restaurant, for example, due to that restaurant being recommended to all eaters, it will cause problems too. For example, the restaurant may not be able to handle the sudden increase in incoming orders so food preparation may get delayed, or even worse, the quality of the food may be compromised. And even if the restaurant can prepare all orders in time, we may not have enough nearby delivery-partners to pick up the food and deliver it to the eater. So either the order goes unfulfilled or we dispatch a delivery-partner who is too far away to pick up the food in a timely manner, which may cause other cascading problems. As a result, such an unbalanced market demand-supply dynamic degrades the overall Uber Eats experience.
References
- Rex Ying, Ruining He, Kaifeng Chen, Pong Eksombatchai, William L. Hamilton and Jure Leskovec: Graph Convolutional Neural Networks for Web-Scale Recommender Systems, KDD 2018
- Alessandro Sperduti and Antonina Starita: Supervised neural networks for the classification of structures. IEEE Transactions on Neural Networks, 1997
- Marco Gori, Gabriele Monfardini and Franco Scarselli: A new model for learning in graph domains. IJCNN 2005
- William L. Hamilton, Rex Ying and Jure Leskovec: Inductive Representation Learning on Large Graphs. NIPS 2017
- Joey Bose, Ankit Jain, Piero Molino and William L. Hamilton: Meta-Graph: Few shot Link Prediction via Meta-Learning. Graph Representation Learning Workshop @ NeurIPS 2019
- Thomas N. Kipf and Max Welling: Semi Supervised Classification With Graph Convolutional Networks. ICLR 2017
- Bing Yu, Haoteng Yin and Zhanxing Zhu: Spatio-Temporal Graph Convolutional Networks: A Deep Learning Framework for Traffic Forecasting. IJCAI 2018
- X. Geng, Y. Li, L. Wang, L. Zhang, Q. Yang, J. Ye, and Y. Liu, Spatiotemporal multi-graph convolution network for ride-hailing demand forecasting, AAAI 2019.
- https://eng.uber.com/uber-eats-graph-learning/
- https://eng.uber.com/uber-eats-query-understanding/
- https://eng.uber.com/uber-eats-recommending-marketplace/
- https://eng.uber.com/restaurant-manager/
- https://rstudio-pubs-static.s3.amazonaws.com/547784_27f8aaca6b8b40c489293816ac81a216.html
- https://youtu.be/UWDVOQq1uzQ
- https://youtu.be/9O9osybNvyY
- https://youtu.be/AiinFkL-pmw
- https://w4nderlu.st/projects/graph-learning
- https://www.cnet.com/news/ubereats-knows-what-food-youre-craving-before-you-do/
- https://rpubs.com/aaitelmouden/601098
- https://woxapp.com/our-blog/to-create-an-application-the-similar-ubereats/
- https://uptech.team/blog/app-like-uber-eats
🧶 Food Discovery with Uber Eats: Recommending for the Marketplace